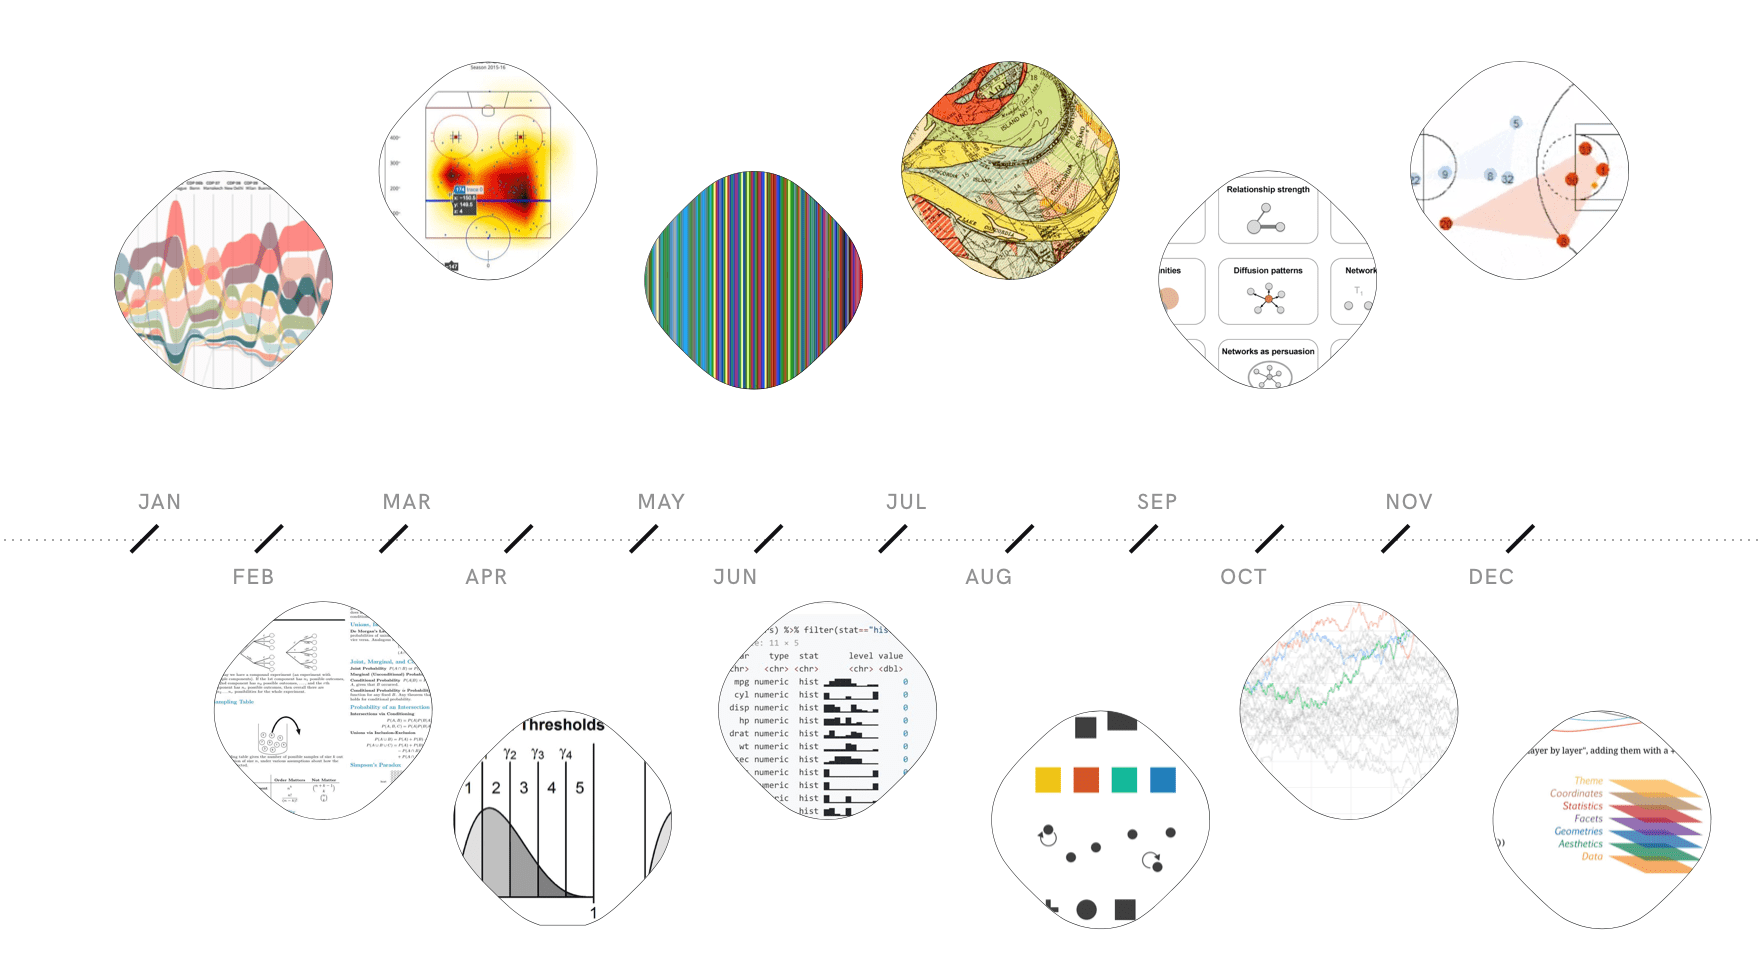
I have no words of wisdom when it comes to summing up 2017. 🙊 So, I guess I’ll let some algorithm do the talking.1 🤖💬 Behold 🙌: two Top Tweets for each month (according to Twitter analytics), some more R-related than others.
January 🎊
RStudio IDE Easy Tricks You Might’ve Missed by Sean Lopp
These are indeed handy! "RStudio IDE Easy Tricks You Might've Missed" by @lopp_sean https://t.co/JFlwhkyCzL via @rstudio #rstats pic.twitter.com/jJtCqsquXv
— Mara Averick (@dataandme) January 23, 2017
Data Visualisation Does Political Things by Joanna Boehnert
Cool paper, relevant af: “Data Visualization Does Political Things” by @ecocene, @EcoLabs https://t.co/BzNl9fa39e #dataviz #infovis #scicomm pic.twitter.com/Pc890zmCEE
— Mara Averick (@dataandme) January 4, 2017
February ❄️
Data Transformation Cheat Sheet via RStudio
In case you've been ignoring useful things, the @rstudio “Data Wrangling” cheat sheet has been updated! https://t.co/3yY1mNM6ul #rstats pic.twitter.com/L37ygj3fDF
— Mara Averick (@dataandme) February 26, 2017
Probability Cheatsheet v2.0 by Joe Blitzstein and William Chen
Legit the handiest, updated: "Probability Cheat Sheets" by @wzchen & @stat110 https://t.co/2YUCG8MjE0 #statistics #probability pic.twitter.com/FdKlXuLtsq
— Mara Averick (@dataandme) February 7, 2017
March 🌬️
DiagrammeR by Richard Iannone
The documentation for @riannone's “DiagrammeR” is so goshdarn beautiful… https://t.co/lE7PM1RO6F #rstats pic.twitter.com/QxwMDhEq8k
— Mara Averick (@dataandme) March 19, 2017
NHL shots analysis using Plotly shapes by Pravendra Singh
Python + hockey + plotly: “NHL shots analysis using Plotly shapes” https://t.co/FrlSjsPRc9 via @plotlygraphs #dataviz #Python pic.twitter.com/QUxKW0JUnI
— Mara Averick (@dataandme) March 2, 2017
April ☔
A Compendium of Clean Graphs in R Version 2.0 by Eric-Jan Wagenmakers and Quentin F. Gronau
Great resource, examples w/ code: “A Compendium of Clean Graphs in R” https://t.co/Vmqej47DEU #rstats #dataviz pic.twitter.com/mUDUXVIfjU
— Mara Averick (@dataandme) April 1, 2017
Conditional probability: A Visual explanation by Victor Powell
Love this interactive: “Conditional probability explained visually” by @vicapow https://t.co/eYKZlKNDQK #statistics #visualization pic.twitter.com/jYjG7lcsJb
— Mara Averick (@dataandme) April 9, 2017
May 🌸
Apply Functions Cheat Sheet via RStudio
Woah! R list-columns cheat sheet? I mean, that's the file name on @rstudio github, so… https://t.co/E8EP11R9VH #rstats pic.twitter.com/HCLmZzcR06
— Mara Averick (@dataandme) May 4, 2017
Every Color Of Cardigan Mister Rogers Wore From 1979-2001 by Owen Phillips
With code, too: “Every Color Of Cardigan Mister Rogers Wore From 1979–2001” by @0wenPhillips https://t.co/GoKpwJV650 #dataviz #rstats pic.twitter.com/eaqnkZy1Iz
— Mara Averick (@dataandme) May 22, 2017
June 🎓
skimr: A frictionless, pipeable approach to dealing with summary statistics via rOpenSci
🔥 @rOpenSci unconf proj/📦! “skimr: a frictionless, pipeable approach to dealing w/ summary statistics" https://t.co/rENr5f9FJN #rstats pic.twitter.com/hAFSYERJ6p
— Mara Averick (@dataandme) June 2, 2017
29 common beginner Python errors on one page via Python for Biologists
New to Python? Follow the Python error flowchart by @pythonforbiolog https://t.co/RvCA5hD3gu #python #SoDS17 pic.twitter.com/d4EeKGHVu9
— Mara Averick (@dataandme) June 10, 2017
July 🕶️
Introducing learnr by Garrett Grolemund
Big news day, kids...interactive tutorials in R 💻🎓: "Introducing learnr" by @StatGarrett https://t.co/xoK3OmuFfI via @RStudio #rstats pic.twitter.com/wRnNNhqve7
— Mara Averick (@dataandme) July 11, 2017
You Say Data, I Say System by Jer Thorp
Read this. No matter what you do, this affects you, and it's beautiful. “You Say Data, I Say System” by @blprnt https://t.co/QV0TIEXd1g
— Mara Averick (@dataandme) July 15, 2017
August 😅
Basic Regular Expressions in R Cheat Sheet by Ian Kopacka
🎉 useful cheat sheet: "Basic Regular Expressions in R" by Ian Kopacka https://t.co/q2AlmRjOnp #RegEx #rstats #SoDS17 pic.twitter.com/YTEELCVOEx
— Mara Averick (@dataandme) August 5, 2017
Visualization Analysis & Design by Tamara Munzer
A veritable #dataviz education: "Visualization Analysis & Design"/all @tamaramunzner's talks 🎉! https://t.co/ptUhm7SOYZ #SoDS17 pic.twitter.com/BmWcMp6x4w
— Mara Averick (@dataandme) August 27, 2017
September 🍂
Network visualization with R by Katya Ognyanova
Updated, 💫 start-to-finish, w/ code: "Static & dynamic network visualization w/ R" by @Ognyanova https://t.co/qgoQsRSovv #rstats #dataviz pic.twitter.com/Q4A0QpRHsl
— Mara Averick (@dataandme) September 4, 2017
Data Import Cheat Sheet via RStudio
IMHO, the @rstudio “Data Import Cheat Sheet” is an underappreciated 🌟 resource https://t.co/LveE8Lu2tb #rstats pic.twitter.com/rOOr4zbaac
— Mara Averick (@dataandme) September 3, 2017
October 🎃
Introduction to gghighlight by Hiroaki Yutani
🌟 stuff "Intro to gghighlight 📦: Highlight ggplot lines & points w/ predicates" by @yutannihilation https://t.co/wkYvOU6tu5 #rstats #dataviz pic.twitter.com/laDbTvRvFz
— Mara Averick (@dataandme) October 9, 2017
You draw the chart: How has life changed in 60 years? by Wesley Stephenson
😻 interactives: "You draw the chart: How has life changed in 60 years?" by @WesStephenson @bbcnews https://t.co/8kNZpKf0QI #ddj #dataviz pic.twitter.com/1gtzTk9m7n
— Mara Averick (@dataandme) October 26, 2017
November 🦃
Working with Play-by-Play Sports Data: Using SQL & R by James Curley
ICYMI, R ✕ NBA ⇨ 😍 “Working with Play-by-Play Sports Data: Using SQL & R” by @jalapic https://t.co/ZfPYeA6W6F #rstats #dataviz pic.twitter.com/Lq0UpTMNyz
— Mara Averick (@dataandme) November 4, 2017
tidyverse 1.2.0
✨ tidyverse 1.2.0 has some *very* important funs… https://t.co/ldkGF3nt8S #rstats #tidyverse pic.twitter.com/vVuX7Xnjgr
— Mara Averick (@dataandme) November 8, 2017
December 🎄
Visualizing text data with ggplot2 by Colin Fay
🌟 deck from @_ColinFay 's 🗣
— Mara Averick (@dataandme) December 6, 2017
📽 "Visualising text data w/ ggplot2" https://t.co/74UXJAoZcL #rstats #dataviz #tidytext #ggplot2 pic.twitter.com/5OMblSOiLn
With some mild editorializing to include at least a few useful things along the way.↩
